
Improving Availability while sneaking from OOM Killer
/ 9 min read
Table of Contents
Most of us are well familiar with the fact how memory-intensive Java processes can be. The system needs to scale up as the memory usage increases but there is no such thing as infinite scalability which clouds talk about. The end result is Linux Kernel OOM Killer activating and killing the Java process.
[26553.503363] Out of memory: Killed process 1688 (java) total-vm:9704312kB, anon-rss:2365028kB, file-rss:4kB, shmem-rss:0kB, UID:0 pgtables:5824kB, oom_score_adj:0At glean we run plethora of Java applications and one of them is git crawler. In this blog, I will talk about how we made infrastructure changes — memory limits, health probes, and automatic restarts — to prevent OOM kills, improving availability of our git crawler by up to 7x for some customers. Let’s get into it starting with first a brief introduction about the infrastructure we have in place for crawlers.
Infrastructure
The original git crawler service is a Java app that runs as a docker container on VM hosted as Compute Engine (GCP) with Persistent Disk or EC2 Instance (AWS) with EBS Volume.
For the K8s version we are using a statefulset with dynamically created persistent volume using storage class.
In case you haven’t read the whole blog on git crawler, the gist is git crawler is responsible for running git commands like clone, log, pull, etc which are very high in memory and have a IO bound nature.
High Memory Usage
Due to the high memory nature of app it frequently had to face the wrath of Linux OOM Killer leading to the container being killed with a SIGKILL signal.
In case of a container running on VM we had to recreate the VM completely to make sure the setup script runs again and VM gets a clean state to begin crawling again. This requires a complete deploy operation using Terraform to rebuild the EC2 resource.
Things are much better in case of Kubernetes based statefulset service because there kubelet takes care of ensuring the running containers are healthy and if they die it brings them up automatically.
Vanilla Docker Improvements
We realized later that we could achieve this parity in terms of automatic restarts while using vanilla docker also.
This was figured out quite late but we could pass in restart policy for a container being ran using docker run.
sudo docker run -d -p 8080:8080 ${IMAGE_URL}docker run -d -p 8080:8080 --restart=always ${IMAGE_URL}With this in place we saw improvements in restart behavior but there was another issue — OOMs were destabilizing the whole VM instance.
VM Destabilization
The destabilization as a result of memory hogging git commands would cause trouble for aws cloud-init and ssm agent process to start in the dearth of available memory.
aws ssm describe-instance-information --filters "Key=InstanceIds,Values=$INSTANCE_ID" --region $AWS_REGIONThe output signaled that PingStatus: ConnectionLost so we can’t even ssh into the EC2 instance for triaging. The only available way to support the claim was checking console logs
aws ec2 get-console-output --instance-id $INSTANCE_ID --region $AWS_REGIONThe way to resolve this was adding memory limits for the docker container relative to total available VM memory, so that there is always some buffer for other processes to run along side the Java App.
TOTAL_MEM_KB=$(awk '/MemTotal/{print $2}' /proc/meminfo)CONTAINER_MEM_MB=$(( TOTAL_MEM_KB * 80 / 100 / 1024 ))
docker run --memory="$${CONTAINER_MEM_MB}m" --memory-swap="$${CONTAINER_MEM_MB}m" -d -p 8080:8080 --restart=always ${IMAGE_URL}
We limited the docker container memory limit to 80% of total available VM RAM size. This prevented the container from ever destabilizing VM with memory hogging as it would get killed and restart at 80% usage itself.
GCP Stability
Git Crawler running on Google Compute Engine (GCE) was more stable than the AWS one. The differences were associated with the deployment abstractions we had in our GCP deployment.
One thing unique about GCE was that it ran containers on Container Optimized OS which was made specifically for running docker containers on VMs providing additional stability and auto resize capabilities.
In our abstraction any java service that wanted to run on COS based GCE was plugged in as a systemd service providing automatic restarts using the kernel.
In AWS the docker container was just ran as part of the startup script — it wasn’t a daemon, so it could die and never be restarted until --restart was added. This was the key difference in reliability between the two.
The other difference was GCP VM was a e2-highmem-4 with 32Gi of available memory whereas AWS was a measly t3.medium with 4Gi memory. For this oversight the AWS git crawler used to suffer far more OOMs than GCP one.
We upgraded AWS instances to use t3.xlarge with 16Gi, as we have seen the load to be around ~12Gi.
Uptime Improvements
| Customer | Previous Uptime | New Uptime |
|---|---|---|
| C1 | 0% | 96.3% |
| C2 | 15% | 96.9% |
| C3 | 76.7% | 94.3% |
The uptime is measured based on a health check, which runs every hour. So we are assuming the worst case of 1 hour downtime but in most cases of healthy operation it would be a few minutes as a result of deploy operation re-creating the VM.
Kubernetes Health Probes
With VM-based deployments stabilized, we turned to our Kubernetes workloads where we wanted to go further — preventing OOMs entirely as recovery part is already taken care by kubelet.
For the statefulset we wanted to prevent ever reaching a state of OOM because you can never gracefully handle a SIGKILL.
So we want to replace SIGKILL with a preemptive SIGTERM. We utilized health probes which is what kubelet monitors and based on their state decides to recreate containers utilizing a SIGTERM to stop the existing one.
Health Probes
Health probes are a way to run diagnostic check on the containers. There are three kinds of probes:
- Startup Probe: Process inside container has been initialized. On failure pod is killed and subjected to restart policy.
- Readiness Probe: Pod is ready to serve requests. On failure it’s removed from the service endpoints.
- Liveness Probe: Pod is alive. On failure pod is killed and subjected to restart policy.
So, to shed the load we used readiness probe with a check on a memory used up to 90% by reading the cgroup counters.
# cgroup counter for memory utilizedMEMORY_USED=$(cat /sys/fs/cgroup/memory.current)
# cgroup counter for memory limitMEMORY_LIMIT=$(cat /sys/fs/cgroup/memory.max)# threshold at 90%MEMORY_THRESHOLD=$(( MEMORY_LIMIT * 90/100 ))
[ $MEMORY_USED -lt $MEMORY_THRESHOLD ]The files memory.current and memory.max are live counters containing value in bytes.
memory.maxstores the hard limit on memory for the cgroup.memory.currentis the total amount of memory currently being used by the cgroup and its descendants.
Memory Metrics
It is the responsibility of operating system to ensure that memory is always 100% utilized which is good actually and for that it even keeps cache of file pages not actively used still in RAM.
The metric we were reading was container_memory_usage_bytes
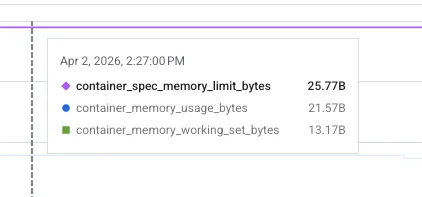
Since container_memory_usage_bytes includes inactive page cache, it overestimates actual pressure. So instead of looking at memory usage we had to look at working set memory as that is what is considered by OOM killer also as it evicts the inactive page caches.
The working set memory is defined as:
# inactive page cacheINACTIVE_MEMORY=$(grep '^inactive_file ' /sys/fs/cgroup/memory.stat | awk '{print $2}')# working set = total - inactiveWORKING_SET_MEMORY=$((MEMORY_USED - INACTIVE_MEMORY))The working set memory is still a loose definition of how much memory a process needs to operate. Even the so called “active_file” pages might not actually be in active use.
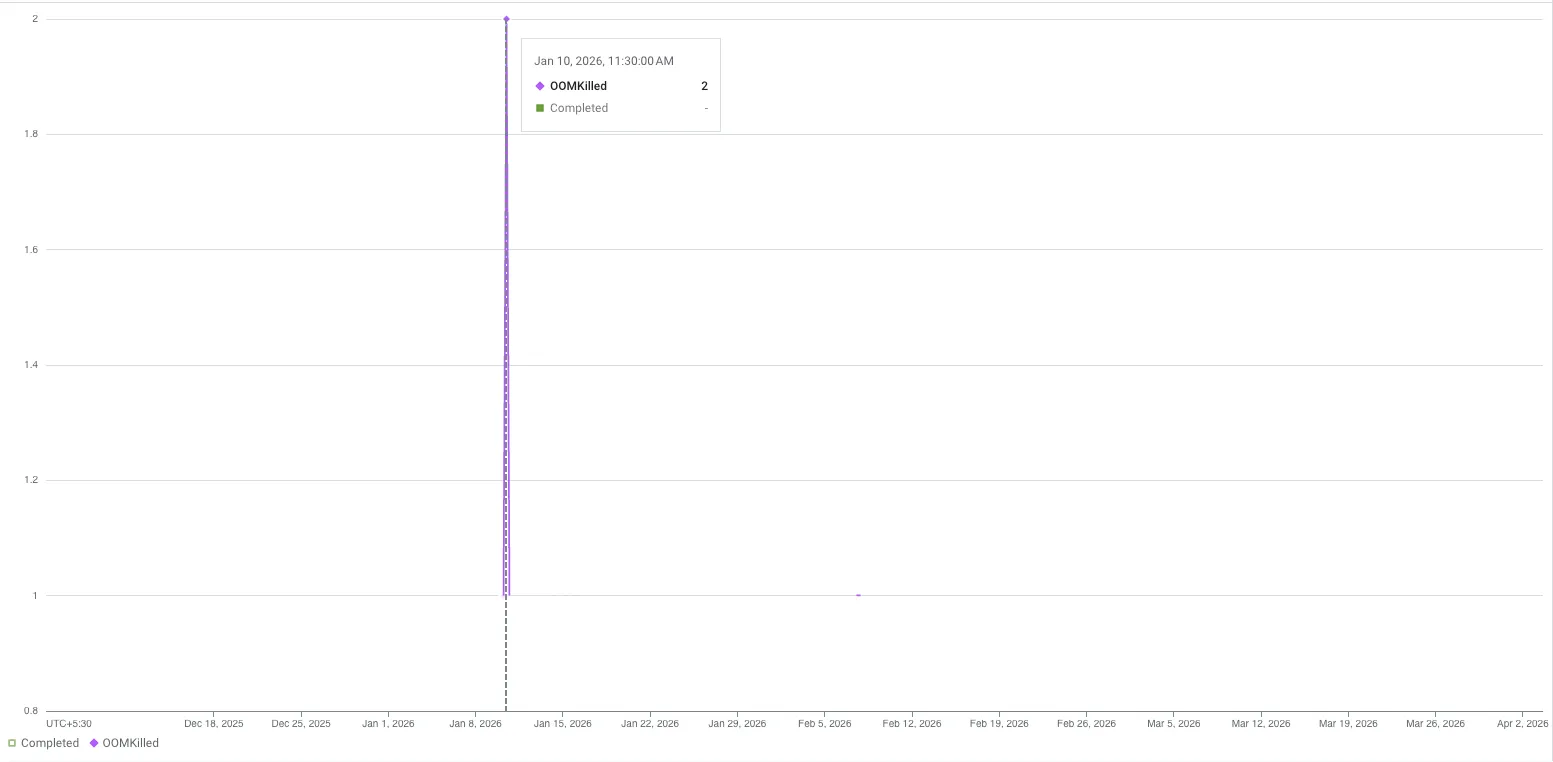
OOM Incidents
Final result was just no OOM event in past 2 months and the 2 before that was before we added health probes.
Conclusion
With increased uptime we are better able to crawl and include updates to code files in glean index making it a lovely place for me and other engineers to engage with code and understand it using chat assistant.
The learning primarily, I would say was around diffing a stable (GCP) and an unstable (AWS) system to realize the gaps and fixing those to get parity.
But the most interesting use case was using health probes for reducing the memory build up as that doesn’t seem to be the intended use case for them but more like a clever use.
While researching for this blog I particularly found the sourcegraph blog an insightful read to check for metrics which can provide details about whether the system needs more memory based on page faults. I am planning to add those in glean’s kubernetes clusters and monitor for further improvements.
I have a few other kubernetes and resource exhaustion related blogs coming up soon. Till then thanks for reading and happy vibing :)

Cover Photo by mr doorm